


We always say that displaying data on a map is one of the best ways to bring information to life, especially when the information has a geographical element. One obvious place where this is true is when looking at the pattern of earthquakes.  The US Geological Survey publishes a list of recent earthquakes. However, a list doesn’t show the patterns or relationships in the same way that displaying this data on a map will.
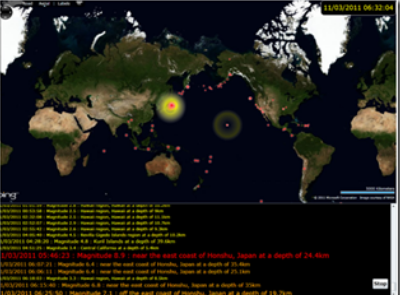
Which is why, given recent events in Christchurch and Japan in particular, we have done just this – embedded USGS’s earthquake data in a Bing Map using Silverlight technology to create a mapped sequence of earthquakes between 7th and 11th March 2011 as recorded by USGS).
In the sequence you can clearly see the build up of earthquakes in the northern part of the Ring of Fire along the Aeultian Islands starting from the 7th of March 2011.
As well as watching the sequence of events from 7th to the 14th of March 2011, you can experience the last seven days earthquakes or just the last one:
Last seven days of earthquakes in mapped sequence
Last day of earthquakes in mapped sequence
For a more detailed view of the locations experiencing major earthquakes during this period watch our video of the sequence.